Showing posts with label glasgow. Show all posts

Friday, 4 April 2014

Some thoughts on mapping spatial patterns of deprivation

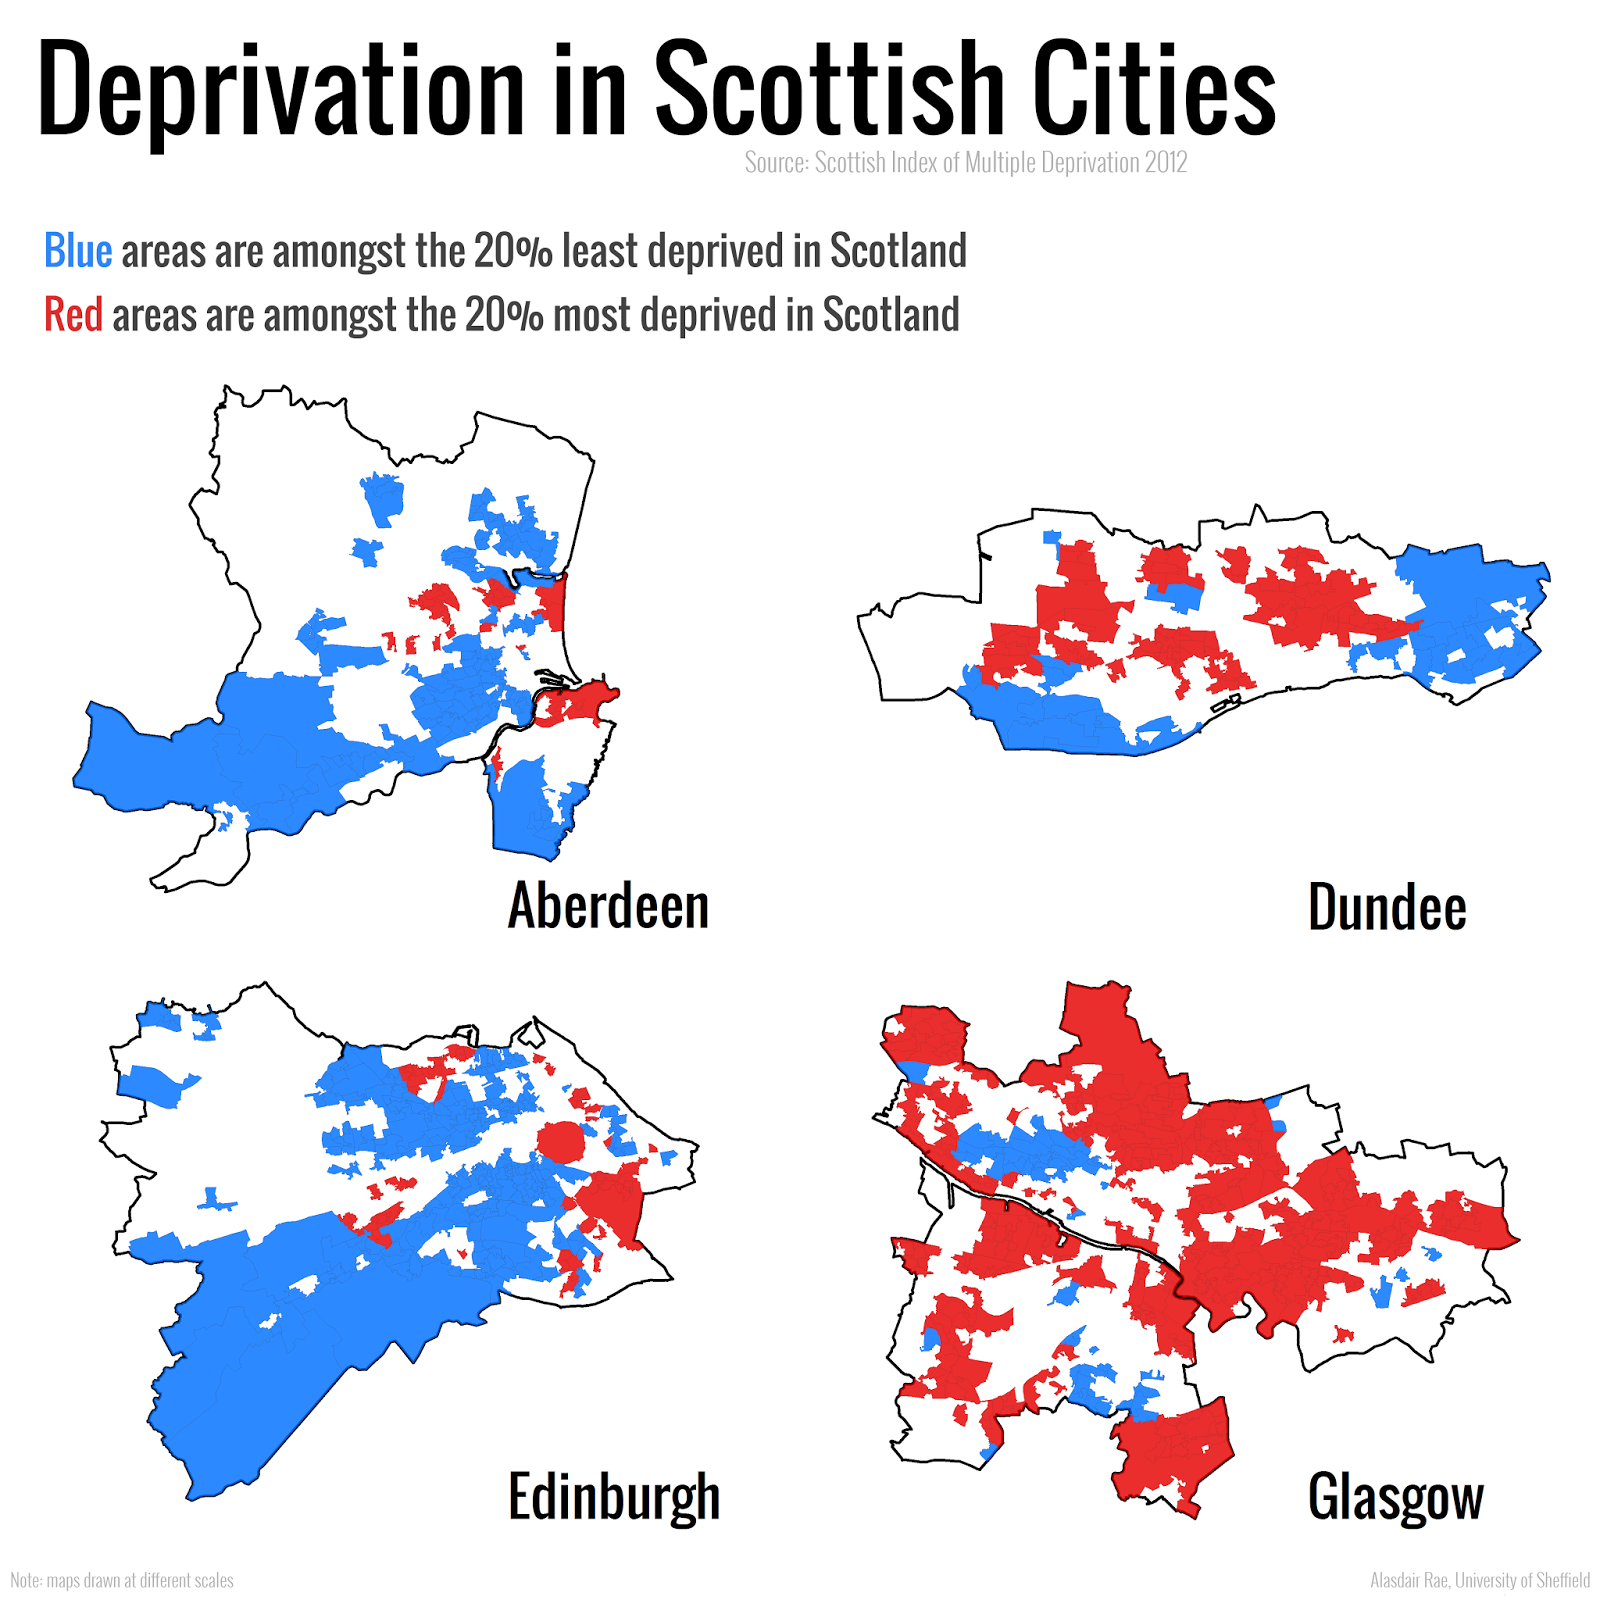
In my research into the geography of deprivation across the UK, I frequently use maps to illustrate the spatial patterns associated with the areas identified as 'least' or 'most' deprived according to official indices such as the Scottish Index of Multiple Deprivation or the English Indices of Deprivation. Lots of other people do similar kinds of things, including mapping gurus such as Oliver O'Brien from UCL (his work is much nicer). A recent example is shown below, which I also tweeted this week. It's difficult to know exactly how people will interpret such maps, particularly when they are only seeing them on twitter without much in the way of context being provided, so this short blog fills some of the gaps and discusses some wider issues.


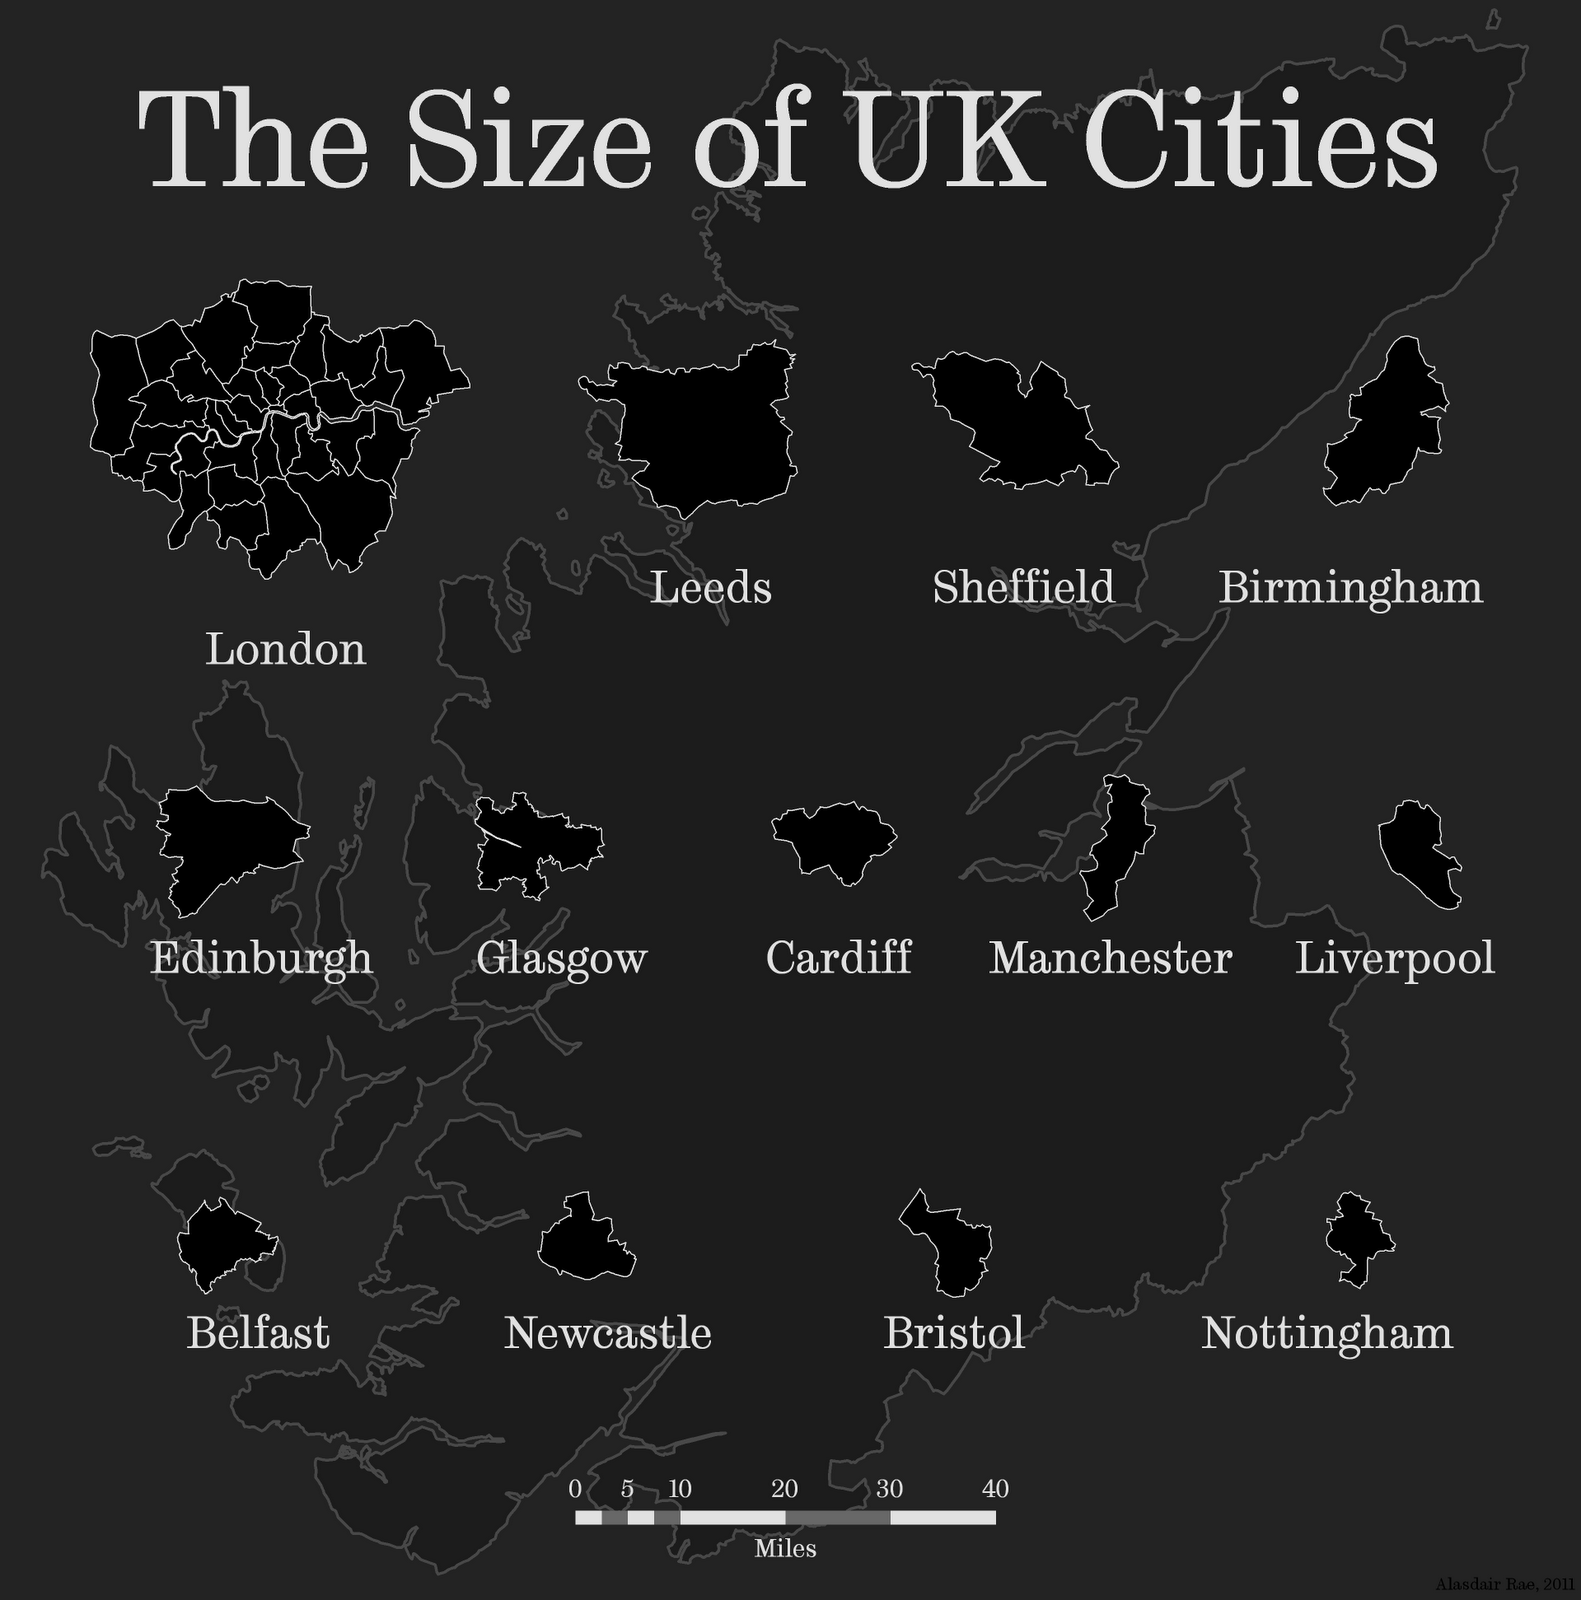
In previous academic papers (e.g. Urban Studies, 2009; Regional Studies, 2012; Local Economy, 2012) I've written about deprivation quite a bit, and on the need for the debate to centre not just on 'deprived' areas but more widely upon the wider dynamic of socio-spatial inequality. It's a shame that the focus is still very much on 'poor' or 'deprived' areas so in an attempt to draw attention to the urban inequalities which exist across the UK I attempt to illustrate the socio-spatial disparities within different cities. I also did this in a report on Sheffield from 2011 where I tried to draw attention to the socio-spatial inequalities within English cities, as shown below. It's not that concentrated deprivation isn't a problem (far from it) but rather that it's part of something much bigger.


These kinds of maps do draw attention to the general issue but of course they can lead to all sorts of other conclusions and claims because as we know, maps are an abstraction from reality and they do not represent an absolute 'truth'. These maps simply colour small areas within cities according to how they are classified by a government metric which attempts to say how 'deprived' places are. This may be a dubious practice in many respects, but it is woven into the fabric of how places are understood in a policy context and how problems are defined. It's important that we understand what this kind of mapping allows us to say and what it does not. Some of this is covered on the 'What does it all mean' tab of my Scottish Index of Multiple Deprivation 2012 map site, but I want to make a few more points here...

1. Colours. They are not intended to match up to any political party but some people inevitably make such inferences. The maps say nothing about the causes of the patterns, or who is responsible for them. But it doesn't stop people from talking about it and that's no bad thing. There is a lot more that could be said about colour choice but I'm going to leave it there for now.

2. The trouble with choropleth maps. Maps shaded according to some value (such as deprivation rank) present a misleading picture in a number of ways but two important ones stand out here: a) not all people in the area are 'deprived' or 'non-deprived'. This is the classic 'ecological fallacy' issue at work - the third paragraph here says more about that; and b) the shaded zoned themselves cover much wider areas than people actually live in so a big blue or red area gives the impression of a lot of something, when in fact the population of larger spatial units is similar to the smaller ones (as it often is with LSOAs or Data Zones in the examples above). 

3. The sometimes arbitrary nature of local authority boundaries. Places like Leeds are often said to be 'overbounded', whereas Manchester is 'underbounded'. This means that the local authority boundary either extends beyond the core urban area or it doesn't include much of it at all. So, in the cases of Manchester and Liverpool above if you were to extend the boundary of the map you would see more areas that are not so deprived. However, the point here is that local authorities have to deal with the financial, social and spatial implications of these patterns. What happens beyond the boundary is not part of their remit - even if it does impact upon them. The boundaries may be arbitrary in some respects but they have very real implications.

4. Why not take a different approach? A good idea, and one that Oliver O'Brien in particular has been very successful with. If we only look at where people actually live then we get a more realistic (but still not 100% accurate) picture of the spatial patterns associated with deprivation. This can be done using dasymetric mapping, where we assign the attributes of areas to individual features. This isn't a perfect definition, and the technique itself can lead people to assume a higher level of accuracy than can actually be obtained from the underlying data but it has advantages over standard choropleth maps in relation to depicting the places where people actually live or work. See also Neal Hudson's London tenure map in this style. The new OS Open Data VectorMap District buildings layer for Great Britain allows us to do this, so I've produced an example map for Glasgow based on the one in the first image above. This time you can only see the areas where there are buildings (though many are not residential properties).


Is the map above more 'truthful' than the normal choropleth? Probably not. However, this is all irrelevant if we aren't concentrating on the underlying patterns we're trying to draw attention to in the first place. The point is that in cities like Liverpool, Manchester and Glasgow the high levels of deprivation/poverty/disadvantage sit in stark contrast to areas at the other end of the scale. Also, places that we think of as 'deprived' are often far from it - as Peter Matthews might also argue. It's this kind of inequality which I'm attempting to highlight with my mapping - though I do of course like a nice looking map (I've also produced more than a few stinkers in my time). The point of all this? I hope that these maps can start a conversation about the underlying issue. I'll end with an extract from my 2012 Regional Studies paper on the issue...


Thursday, 4 April 2013

Child poverty in the United Kingdom - for small areas

As I mentioned in my last post, I'm currently doing some work on child poverty and social mobility. I did this for English parliamentary constituency areas in 2011 but the problem I had then was that I didn't have a dataset that covered the entire UK at the small area level. Since then, however, I've been looking more into the HMRC's child poverty statistics and their revised local child poverty measure (linked to the Child Poverty Act 2010). To cut a long story short... I've mapped child poverty at the small area level for the whole UK - for those areas where child poverty is at 33.3% or higher (the UK average is 20.6%). The map is zoomed to London but you can zoom around and use the full screen version. Click on an area to find out more.


The highest value in the UK is in part of Springburn in Glasgow - with a value of 83.3% of children in poverty according to the HMRC definition. The highest value for anywhere outside Scotland is 75.0% in part of east central Manchester. 

Some technical information... The small areas used are Super Output Areas in England, Wales and Northern Ireland. In Scotland, Data Zones are used. These have around half the population of Super Output Areas (around 800, compared to 1600). Using these smaller areas means that Scottish areas dominate the list of the highest child poverty neighbourhoods in the UK. In the HMRC definition, 'children' are all dependent children aged 0 to 19. They also provide data on child poverty rate for children under 16 and this figure is usually about a half to one percentage point higher (e.g. 21.1% for under 16 compared to 20.6% for the whole UK). The data are from the most recent release - 2010.

Tuesday, 18 December 2012

SIMD2012 - An Interactive Website

With the release of the latest version of the Scottish Index of Multiple Deprivation I thought I would take the time to put together an interactive mapping website so that people who are interested in exploring spatial patterns of deprivation could easily interact with the data. The official Scottish Government interactive mapping site has some nice features but I find it a bit cumbersome and the map interface is too small for my liking so that's why I've produced my own version, based on Google Fusion Tables.


Putting this together has prompted me to develop some additional mapping tools using Fusion Tables code and these can be accessed via the 'Tools' tab on the new website. The 'search and zoom' allows you to enter a place you want to look for and when you hit 'Search' the map immediately pans and zooms to that location.   The other tool I've created simply lets you turn the SIMD map layer on and off, which is quite a useful feature.

I've just looked at the relative ranks of places within Scotland in this site. For details of absolute change you can see the employment and income domain data available from the new SIMD 2012 website.

Sunday, 3 June 2012

Red Road Demolition

A couple of years ago I blogged on the Red Road Flats in Glasgow and their imminent destruction. It wasn't quite as imminent as I thought but it now appears that next Sunday, 10th June 2012 153-213 Petershill Drive will be demolished. As someone with an interest in planning, urbanism, architecture and Glasgow this is a significant event because it represents the end of an era, and in particular the end of the great public high-rise housing experiment that Glasgow embraced. 


153-213 Petershill Drive

The delay in getting to this point is related to the process of moving the asbestos from the buildings, which you can see in this fascinating time-lapse video...


The demolition story is documented on Safedem's Red Road Demolition website and the demolition itself can be viewed live there next Sunday. I'm sure they'll also have lots of video coverage of the event soon after, as they normally do. You can find more details about the original project and architect on these pages.

For me, the most interesting and important aspect of Red Road are the stories told by people who lived there, which are captured on the Red Road Flats website.

Thursday, 13 October 2011

How Big is London?

In studies of cities and urban areas, a common question that crops up is 'how big' a particular city is. I'd be inclined to answer this in terms of population, which for Greater London in mid-2010 was 7.83million. Most urban academics, however, are more pedantic and if you asked them how big London is, they might ask what you mean by 'big' and what you mean by 'London'. So, following the theme of some posts over the past year I decided to take a look at this purely in terms of the land area of some key UK 'cities'. I looked at the London Boroughs for Greater London, plus local authority areas for the English core cities, plus Edinburgh, Glasgow, Cardiff and Belfast. I then put them side by side at the same map scale and produced the following image...


The cities (i.e. the local authorities) in the image above are ranked by land area. London is the largest, at around 610 square miles, and Nottingham is the smallest at around 30 square miles. One issue when thinking about all of this is the extent to which most of the UK's cities are 'underbounded' in the sense that the core local authority area with the name of the city does not reflect the true extent of the functional urban area. Manchester is a classic example of this, whereas Leeds is more 'overbounded'. Tony Champion and Mike Coombes, among others, have written about this - e.g. in this presentation. In many ways this is quite a serious policy challenge, particularly when it comes to understanding and planning for wider metropolitan housing and labour market processes. But I'm getting carried away with myself now!

Finally, I thought it would be interesting to compare the areas in the image above to the UK's largest local authority by area. I did this because a) I'm from the Highland region and b) see reason a). The Highland region is, famously, about the size of Belgium and it is bigger than both Wales and Northern Ireland by some way. In relation to the latter, it is more than twice the size in terms of land area. However, in mid-2010 the total population of the Highland region was only 221,630. A final nugget of information: the Highland region is about 275 times larger than Liverpool. The image below shows the Highland region at the same scale as the areas in the first image. Perhaps we should all move up north and have more space! Or perhaps not.


P.S. The City of London is the smallest administrative 'district' in the UK, at around 1.1 square miles. 

Tuesday, 2 August 2011

Joblessness in Edinburgh and Glasgow


I'm currently finishing off a piece of work relating to spatial patterns of labour market deprivation in Scotland so I thought I'd share a couple of findings about the contrasting cities of Edinburgh and Glasgow*. I've been using data from the Scottish Index of Multiple Deprivation (2009) employment deprivation domain, which gives a jobless rate for each small area (Data Zone). The official explanation is that it is 'involuntary exclusion from the labour force' and it includes things like unemployment claimants and incapacity benefit claimants.

I've been looking at the data within the context of local labour markets and have done some comparisons between Edinburgh and Glasgow. The data are now a bit old (from 2008) but what's really interesting are the numbers... In Glasgow, the total population of Data Zones where the jobless rate was 25% or more was a little over 170,000 (more than the population of Dundee) and areas with a rate of 33% or more contained just over 51,000 people (more than the population of Perth). By contrast, the figures for Edinburgh were just under 25,000 and just under 11,000 respectively. Even when you take into account the difference in population (about 600,000 for Glasgow vs. 450,000 for Edinburgh) that's a big difference! I know this contrast isn't particularly surprising but the numbers did surprise me a bit.


*I've added Aberdeen and Dundee because David Manley suggested it. A good idea!


Sunday, 3 April 2011

Scottish Index of Multiple Deprivation 2009 - Google Map

Recently I've been experimenting with google fusion tables and the mapping and database opportunities they present. One dataset I used for this was the new English Indices of Deprivation for 2010 - something the Guardian picked up. This was only really a quick experiment (literally done over an hour or so) but I was impressed with the capabilities.

Since, I'm from Scotland I also did a Scottish version - click the image below to go to the test site. Again, this is only experimental but I find it useful for exploring the data in an easy to use manner.


Technical note: this also led me to discover the amazing shpescape aka Shape to Fusion for converting shapefiles to fusion format - code which was written by Josh Livni at google. Enough nerdspeak for now.

Monday, 18 January 2010

Red Road Flats, Glasgow

Since they're not going to be with us much longer, I'm writing a short post about the Red Road Flats in Glasgow - a group of eight high-rise social housing blocks in the north of the city. I used to live just over a mile away from them and it will be strange when they are gone since they have been such a feature of the city's skyline for more than 40 years. There's some really interesting material on the flats on this website, set up specially to document their demolition.

Just to be more precise about where they are, here's a Google streetview:


View Larger Map

There's also a series of Quicktime panoramas here (with further links on the right of this page). There's also a gritty/disturbing 2006 film of the same name which is set there. There are hundreds of other potential links, but the final one here is from a short BBC film of the area. The schedule for demolition is a little unclear, but the first block is supposed to be toppled in spring 2010.

Finally, I edited one of my very own Red Road photos (taken in 2005) to see what the skyline will look like from Petershill Road once they are all gone (the picture below is a small animated gif).

Friday, 30 October 2009

Scottish Index of Multiple Deprivation 2009

Being of Scottish origin and interested as I am in understanding and measuring deprivation, the recently published Scottish Index of Multiple Deprivation 2009 is today's topic. It updates previous indices (SIMD2004, SIMD2006) and it measures small area deprivation in a way similar to other deprivation indices used across the UK. More information on the indicators used can be found here, and useful background and methodology information is also available. There's now even an interactive mapping function, based on Microsoft Silverlight and Virtual Earth mapping technology.

There has been quite a bit of press coverage of this, for example - The Times, The Herald, the BBC, and of course the Sun. There was also a press release from the SNP. Here's a screenshot showing the location of the most deprived area in Scotland according to the SIMD2009 (click the image to see it full size).


By the way, the link between deprivation and football stadia is not unique to Glasgow or Scotland. North Liverpool and Anfield on the English IMD2004 and IMD2007 is another good example, as is the Millennium Stadium and the Welsh IMD2005. I will have to do another post on this topic...

Friday, 20 March 2009

Spoke too Soon

Further to my last post about Google Maps street view, where I said that it wasn't available in the UK - just this week it has become available, to much hype and hysteria. Twenty five cities in all, including where I live now (Sheffield), where I used to work (Manchester), where I used to live (Liverpool) and where I went to university as an undergraduate (Glasgow). I've hunted around for people I know, but no luck yet... For now, just some images of places I know - note that you can navigate these within the blog!

Housing Market Renewal Area in Liverpool

View Larger Map

Raining in Manchester? Surely Not...

View Larger Map

Tenements in Glasgow

View Larger Map

Monday, 19 May 2008

Cities are Back?

Just a quick post today regarding the issue of whether British 'cities are back'. Since the report of the Urban Task Force in 1999 and the much-cited 'urban renaissance' cities have been back on the agenda but in a more positive light than in the past. People now seem to want to live in them again, city-centre living has been given a new lease of life and huge amounts of public and private cash have been spent doing them up. However, is all of this a good thing? I would say that overall it is but I just wonder how sustainable it is. What are the implications if it all goes wrong and investors and people flood out of the cities once more? What if people don't really want to live in the shadow of tower blocks forever. What if it is not really a renaissance?

I took this picture in Glasgow in July 2004. Contrast between 1960's tower blocks at Red Road and 2000's new builds. Quite striking I think. An illustration of how urban policy plays out in reality. We'll have to wait and see how the urban renaissance pans out but for now I suppose we ought to wish it all the best and keep track of how things go.